
PowerPoint Interactive Slides: An Executive Dashboard from an Excel Snapshot
Note: This blog is a personal notebook. I write it to record what I work on, for my own reference, not to publish it on social media or to promote myself. If a post is still useful to you, I am glad, but that is not why it exists.
This post was published on October 25, 2026. Software versions, product features, links, and tool availability may have changed since then. Always check official documentation for the latest information. Some screenshots show small details. Zoom in on the page to see them clearly.
Microsoft’s new Copilot app brings Word, Excel, and PowerPoint into one place, called Office in Copilot. The three apps also have Copilot built in, and their agentic capabilities became generally available in April 2026. This post tests one new PowerPoint skill, Create interactive slide, on a Business Central style sales review.
Problem
Scenario: a finance or sales lead exports a Business Central list with Open in Excel and prepares a monthly review. The deck carries a static table. The first question from the room is often about one region or one product, and the answer sits in a backup slide or another file.
A total can also hide an exception. In the demo data, all four regions finish the half year within 3% of target and show On Track. One record still stands out: Cloud ERP in Benelux missed its February target by 25.8%.
Why this matters
An interactive slide lets the presenter start with the overview and open detail only when someone asks. Microsoft describes this as revealing information progressively.
The cost is one prompt, and the trade-off is control. The slide is like a photo of the scoreboard at half-time: you can zoom in on any part, but the score in the photo never changes. It does not replace a governed, refreshable report in Power BI.
Architecture
Pattern: read-only and snapshot-based. Nothing writes back to Business Central.
| Layer | Runs where | Role in this demo |
|---|---|---|
| Business Central | Inside BC | Source of the data in a real case. Not used in the demo. |
| Excel workbook | Excel | A formula-driven Dashboard sheet and a Performance Data sheet with 72 records. |
| Copilot in PowerPoint | Microsoft 365 | Reads the workbook and builds the slide. |
| Interactive slide | Inside the .pptx file | One sandboxed web view that holds a copy of the data. |
Assumption: the workbook has synthetic data and stands in for a Business Central export.
In a real case, Open in Excel on a list page exports the visible columns and does not publish changes back. The user needs the permission set D365 Excel Export Action or system permission 6110 (Learn export article).
I opened the .pptx to check the data boundary. The slide is one embedded HTML block plus a fallback picture. The block holds all 72 records as JSON, with no external URL and no network call. Microsoft says the web views are sandboxed and do not connect to other content or services. The slide is a copy of the data, so protect the deck like the export.
Copilot can also ground a slide in your own content through Work IQ. The Work IQ announcement for Dynamics 365 lists Sales, Service, and Finance and Operations apps. It does not name Business Central, so I do not assume coverage.
Demo steps
Prerequisites: PowerPoint with Copilot on Windows, Mac, or web, and the Excel workbook. Microsoft says there is no separate license for interactive slides. Rollout was due to finish by the end of October 2026.
-
Open a blank deck. On the Home tab, select Interactive Slide. The Copilot pane opens.

-
Attach the workbook and send a prompt like this one:
Create an interactive executive performance dashboard using the attached Excel workbook. Use the Dashboard and Performance Data sheets as the primary sources. Include: KPI cards for total revenue, target revenue, variance percentage, gross margin, new customers, renewal rate, NPS, and on-time delivery; interactive controls for region, product, month, and quarter; a regional comparison of revenue versus target and status; a product comparison of revenue, gross margin, new customers, and NPS; a highlight for the February dip for Cloud ERP in Benelux; a highlight for the May acceleration for Copilot Suite in the Nordics. Use progressive disclosure: start with the executive overview and reveal detail when the audience selects a region or product. Keep the design clean and professional.
-
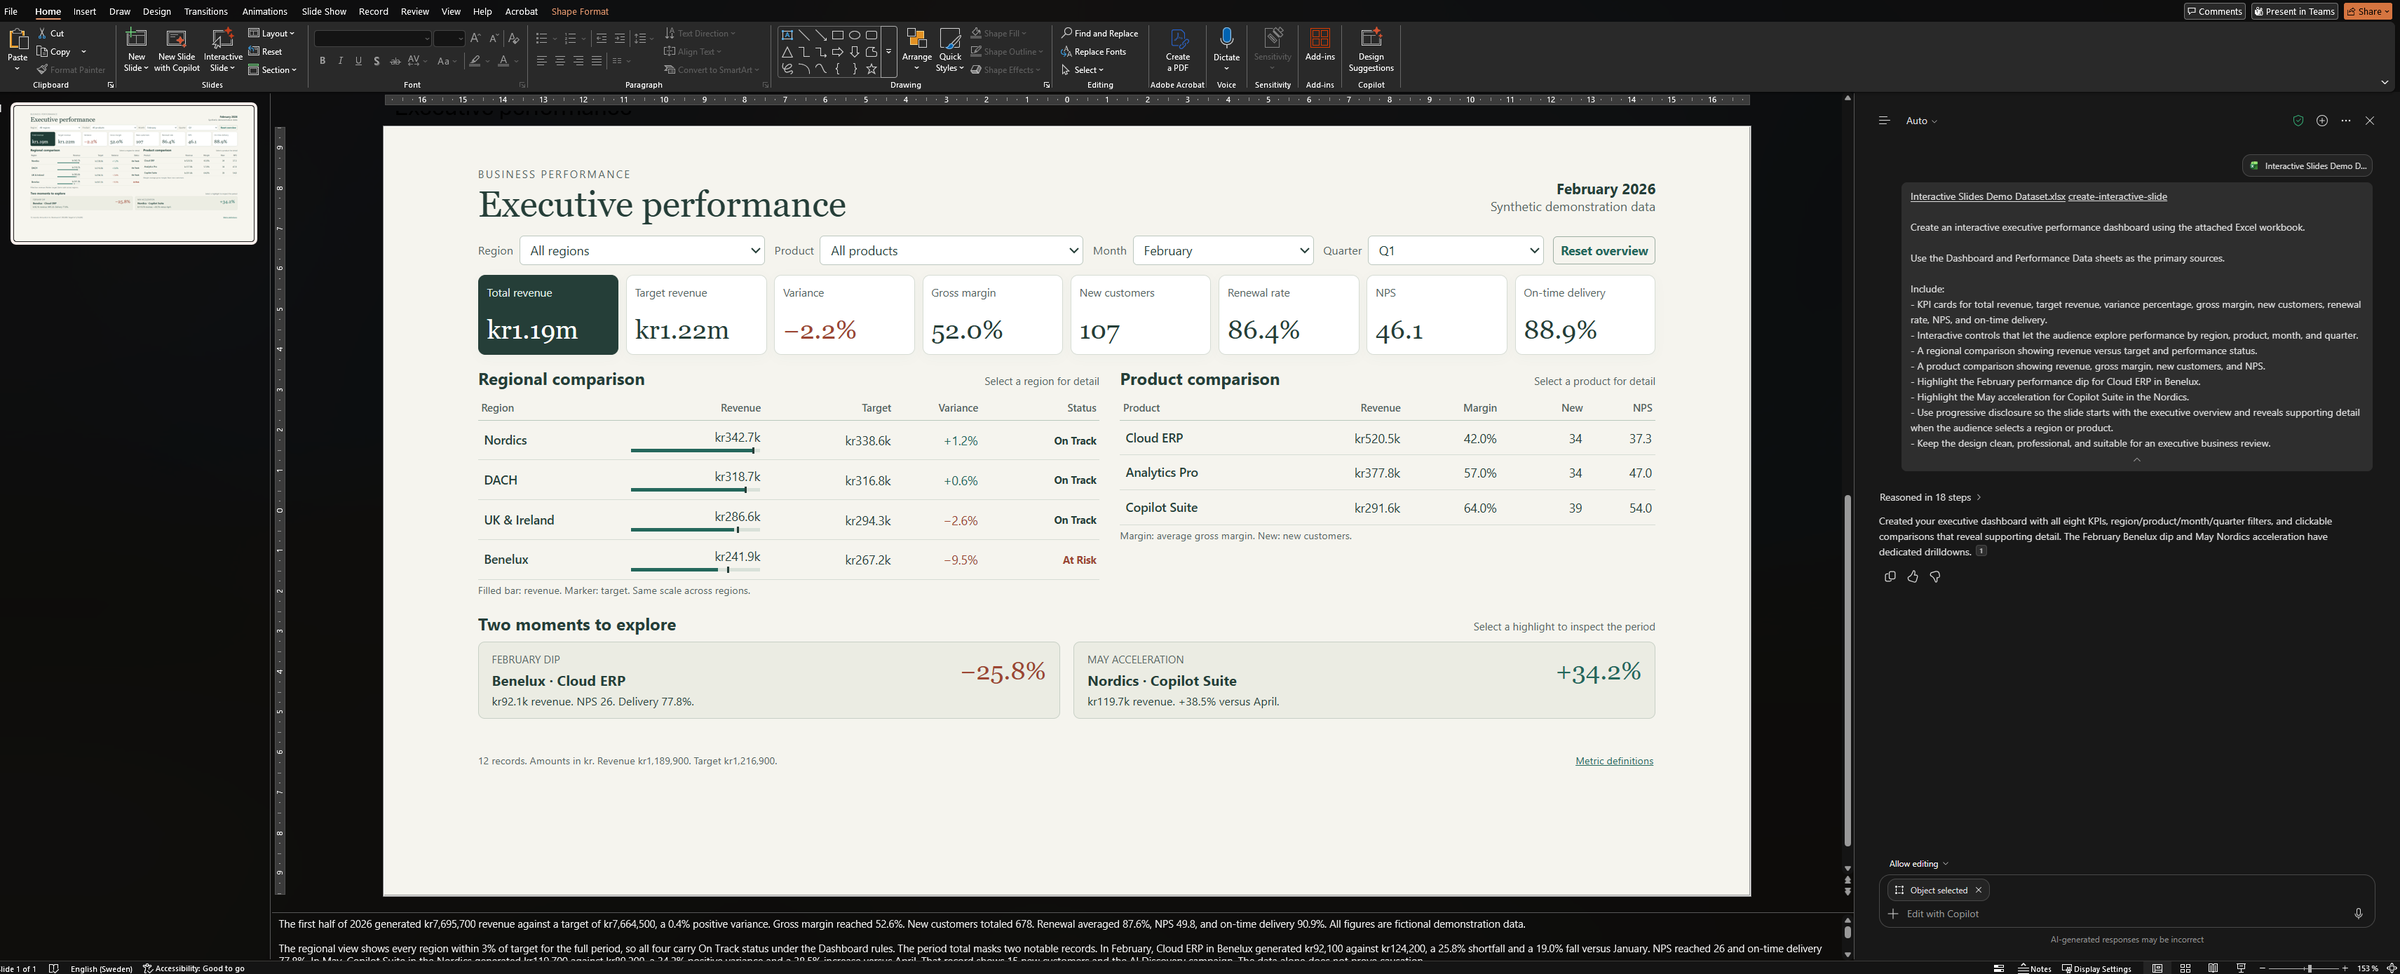
Wait for Copilot to finish. In my run, the result was one full-slide dashboard.
-
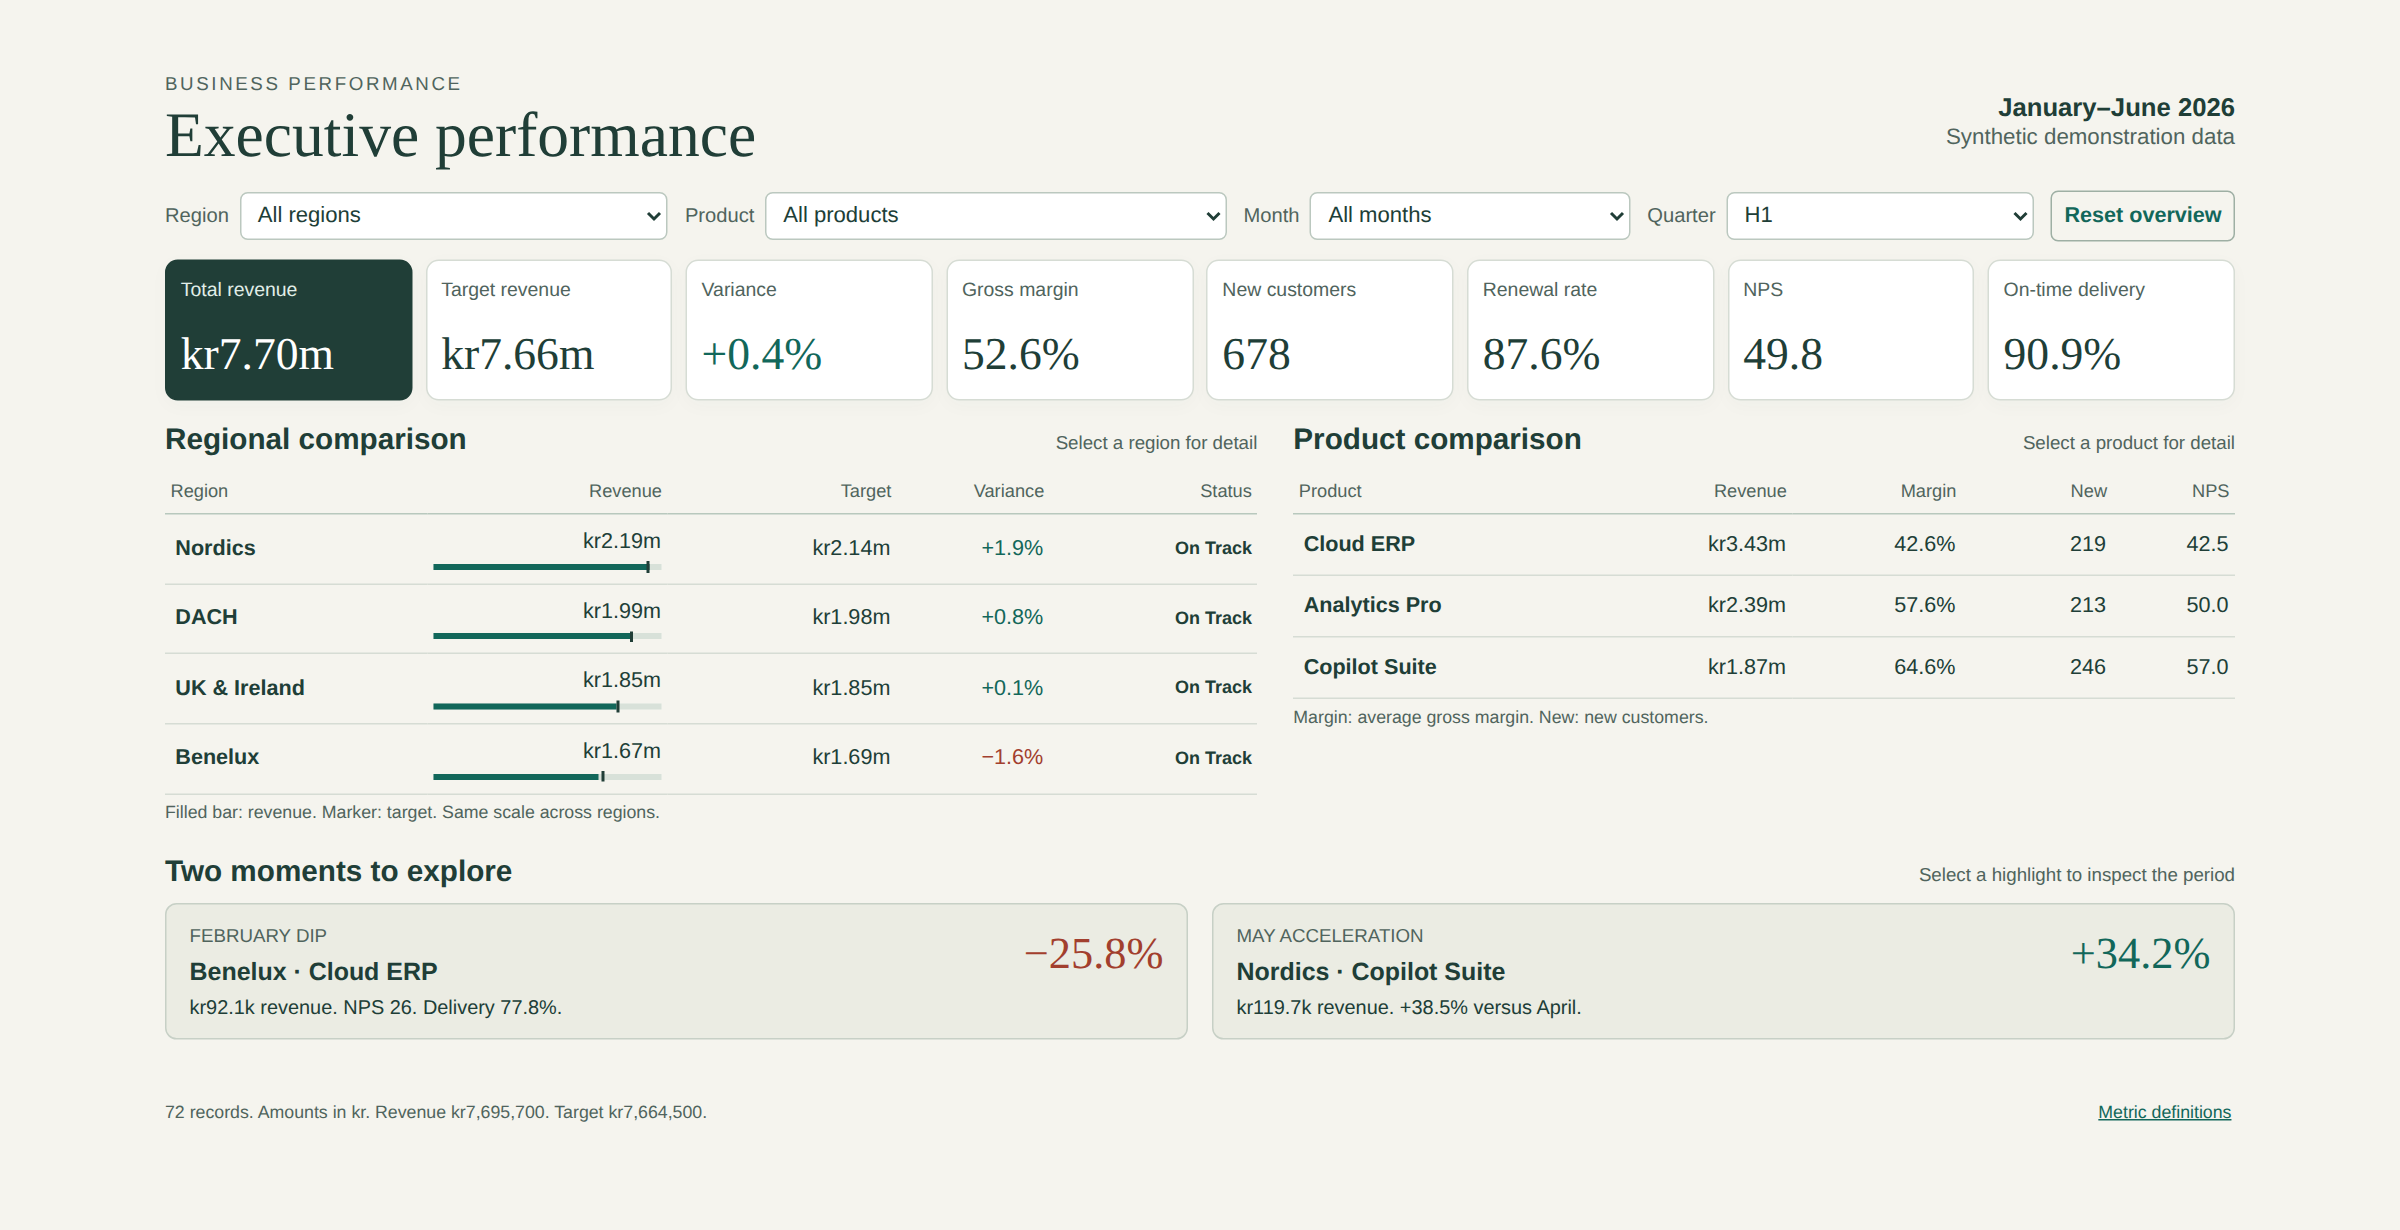
Start the slide show. The overview shows eight KPI cards, two comparison tables, and two highlights. If the slide opens in a filtered state, select Reset overview.
-
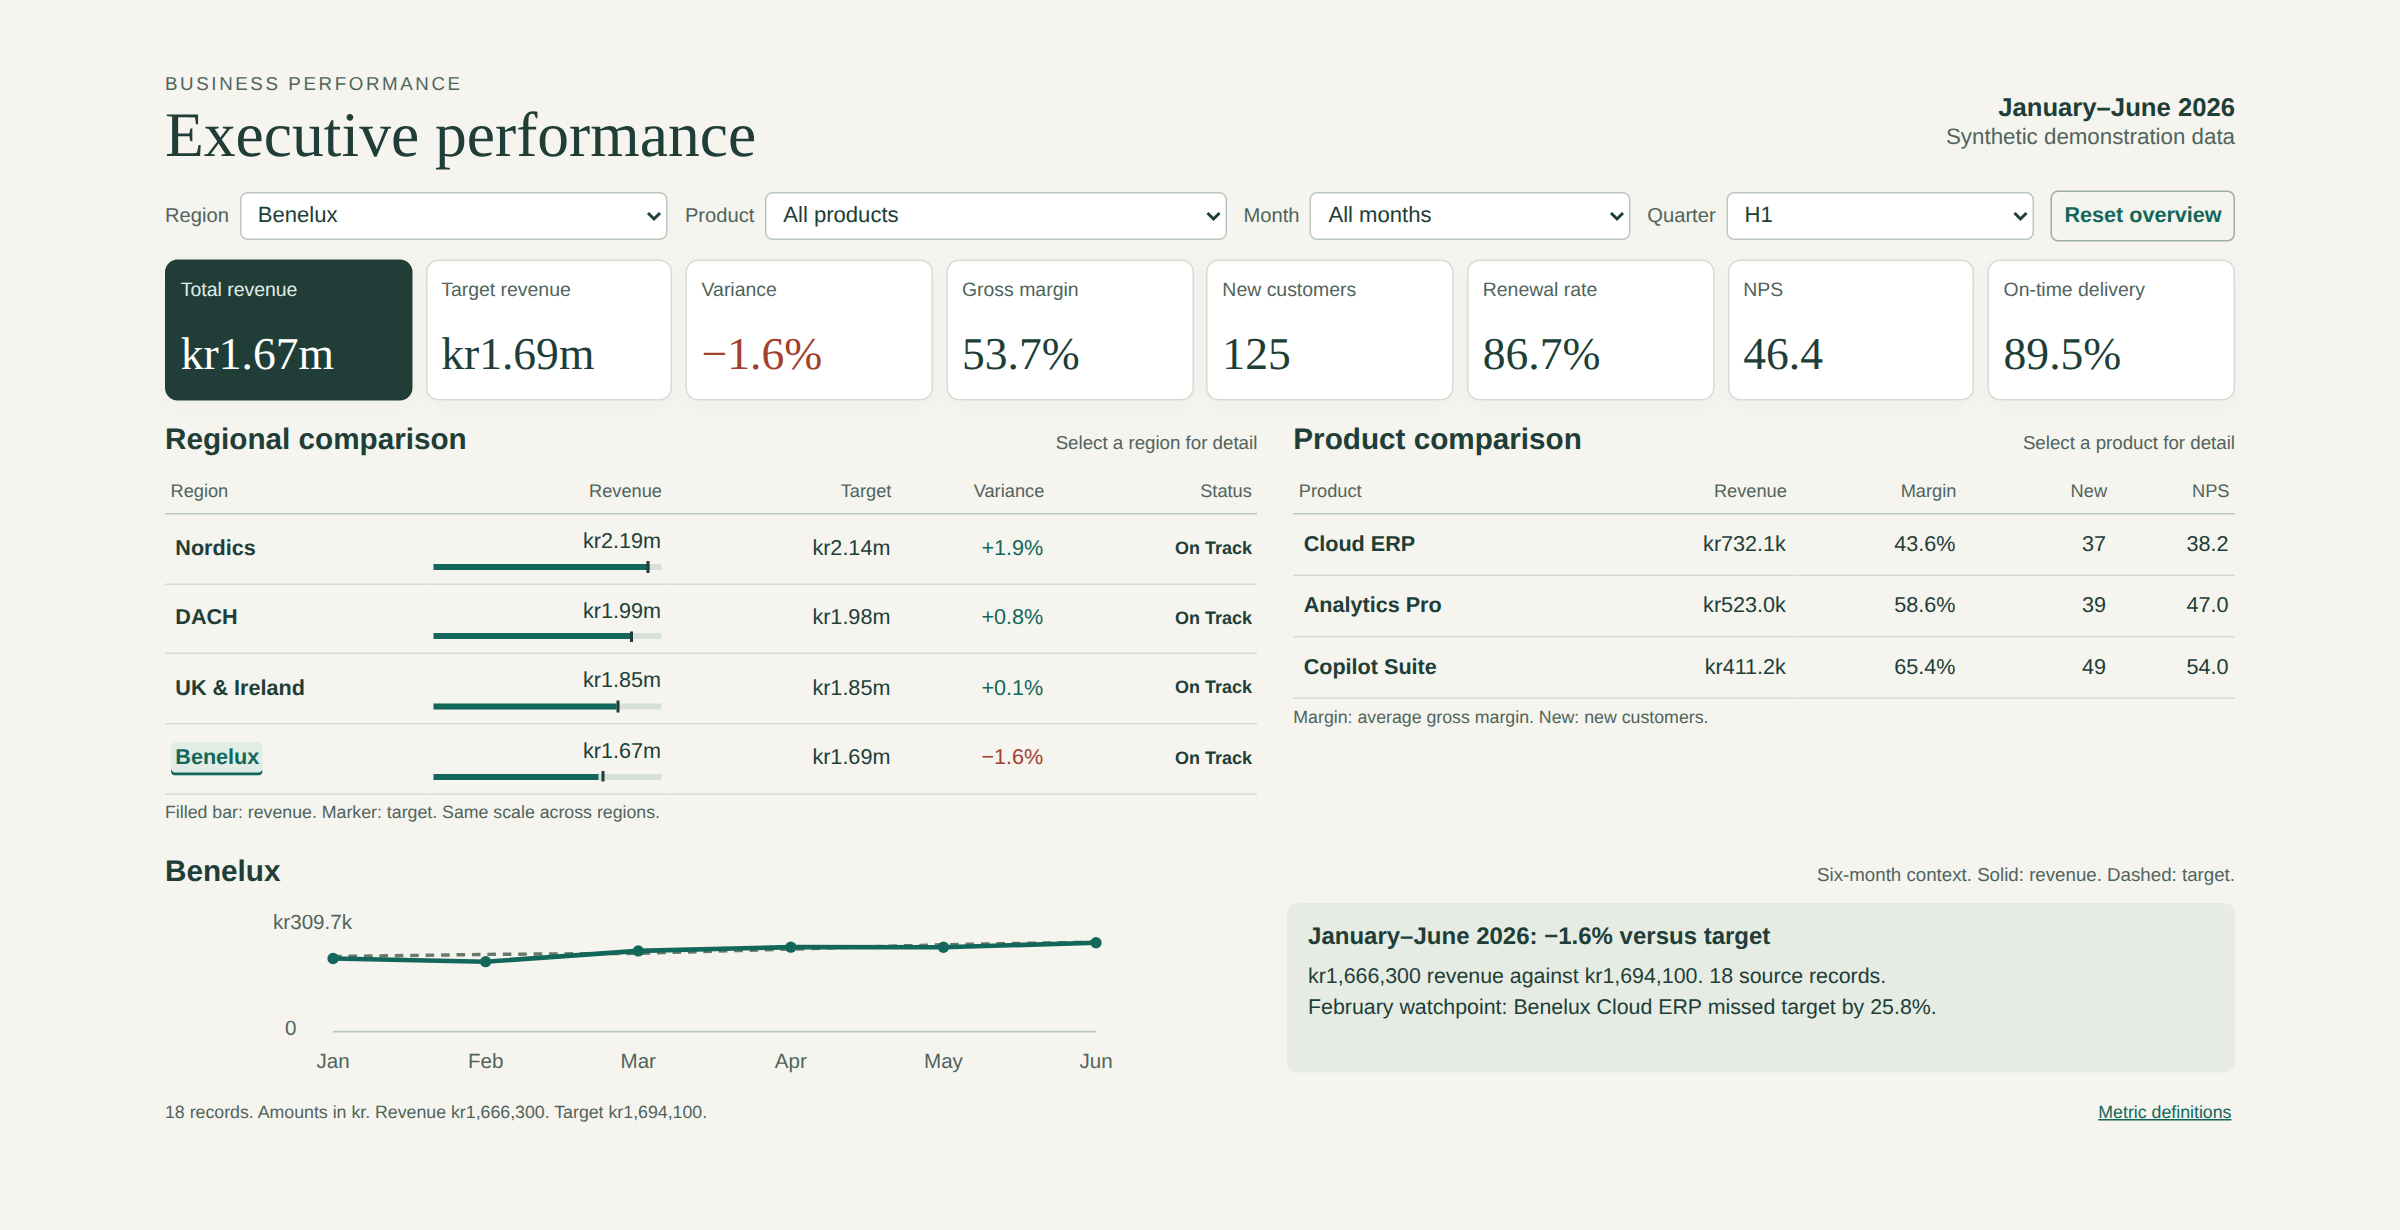
Select Benelux in the regional comparison. The KPI cards recalculate and a six-month trend appears. Benelux shows −1.6% and On Track, but the note names a February watchpoint.
-
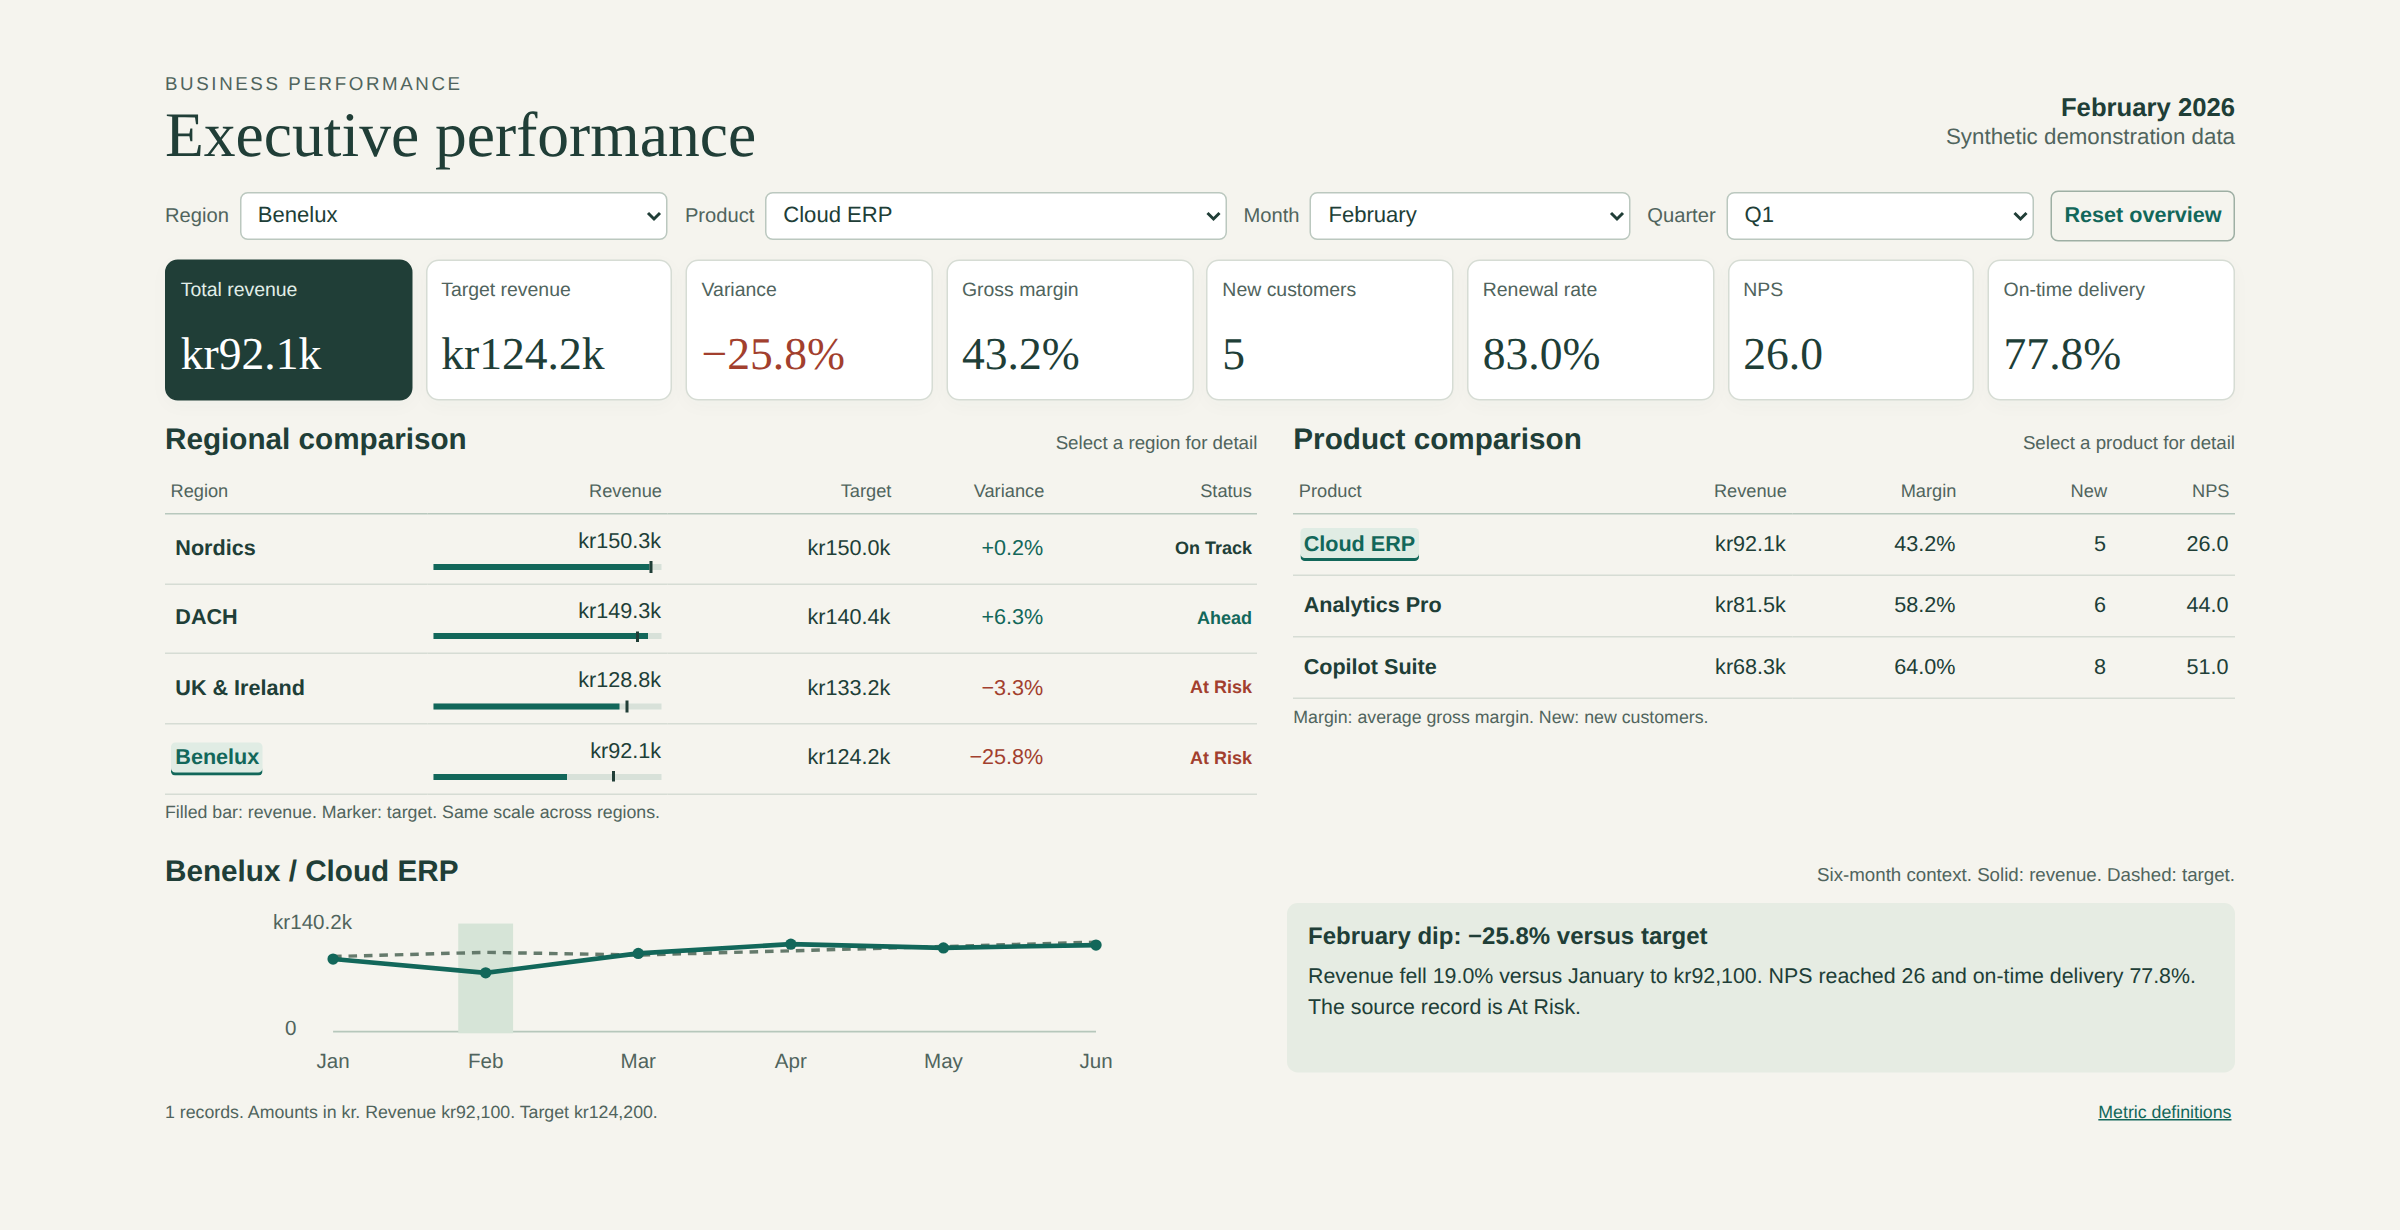
Select February dip. The slide shows kr92,100 against kr124,200 (−25.8%), NPS 26, and on-time delivery 77.8%.
-
Select May acceleration. The slide shows kr119,700 against kr89,200 (+34.2%), 38.5% above April, and 15 new customers.
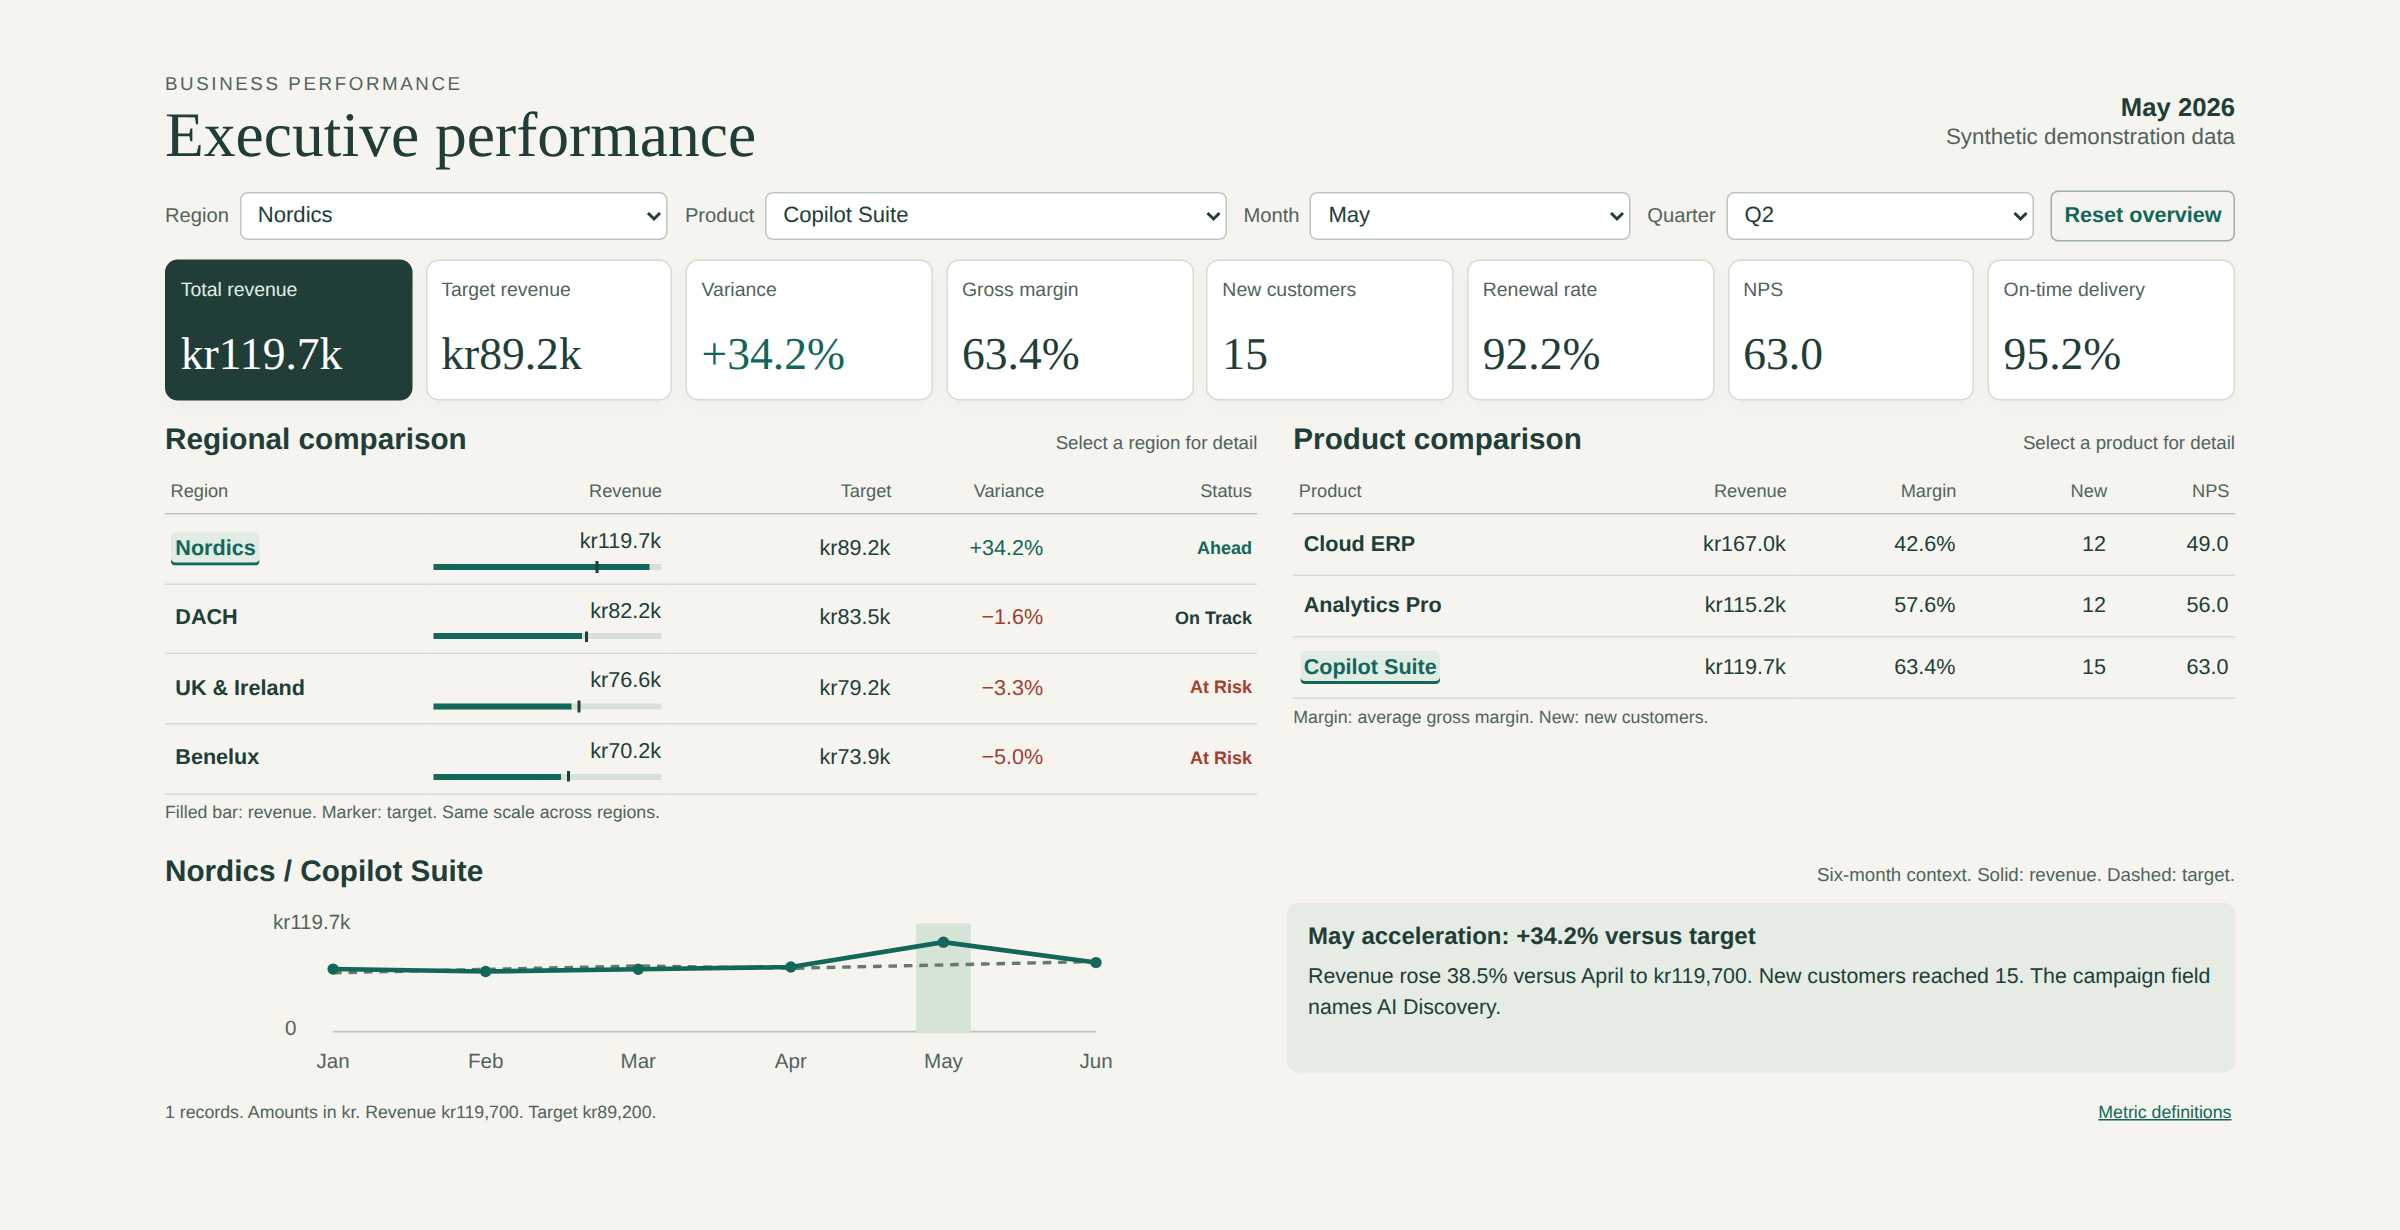
-
Verify. Select Reset overview and compare the cards with the workbook: revenue kr7,695,700, target kr7,664,500, variance +0.4%, and 678 new customers.
Screenshots 03 to 06 show the slide’s embedded HTML in a desktop browser, so fonts differ slightly from PowerPoint.
What is intentionally simple
- One slide, one workbook, one prompt.
- Synthetic data, default styling, and no brand kit.
- The Timeline sheet in the workbook stays unused.
- No test in Teams, on a phone, or with a screen reader.
Risks and limits
- Copilot generates the layout, content, and behavior, and Microsoft tells you to review the result before you present. The slide’s own notes warn that the data alone does not prove why May rose. The “AI Discovery” campaign is only a field in the workbook.
- You cannot edit the slide directly. You change it with another prompt. A reader comment on Microsoft’s announcement reports that an update can change more than you asked, so check the whole slide after each change.
- The data does not refresh from Business Central or from Excel.
- Print and PDF export show a non-interactive image. Interaction is not available on iPhone or Android. On Mac, you can interact in slide show view but not in presenter view.
- In PowerPoint Live in Teams, each attendee interacts alone and does not see the presenter’s clicks.
Next iteration
- Repeat the test with a real Open in Excel export from a sandbox with the CRONUS demo company.
- Test keyboard navigation (Tab and Esc) and Teams presenting before a real executive review.
- Add a checklist that compares each KPI card with the source workbook.
- Re-check Work IQ coverage when Microsoft states whether it includes Business Central.
Closing note
An interactive slide is a good way to present a snapshot, with no connection to Business Central. Treat the deck like the Excel export it came from, and check every number before the meeting.