
Excel Interactive Canvas: A Copilot Dashboard from a Business Central Style Export
Note: This blog is a personal notebook. I write it to record what I work on, for my own reference, not to publish it on social media or to promote myself. If a post is still useful to you, I am glad, but that is not why it exists.
This post was published on October 31, 2026. Software versions, product features, links, and tool availability may have changed since then. Always check official documentation for the latest information. Some screenshots show small details. Zoom in on the page to see them clearly.
Copilot in Excel can now build an interactive dashboard from one prompt. Microsoft calls the feature interactive canvas. The previous post tested the PowerPoint version. This post tests the Excel version on the same synthetic sales data, from a Business Central (BC) point of view.
Problem
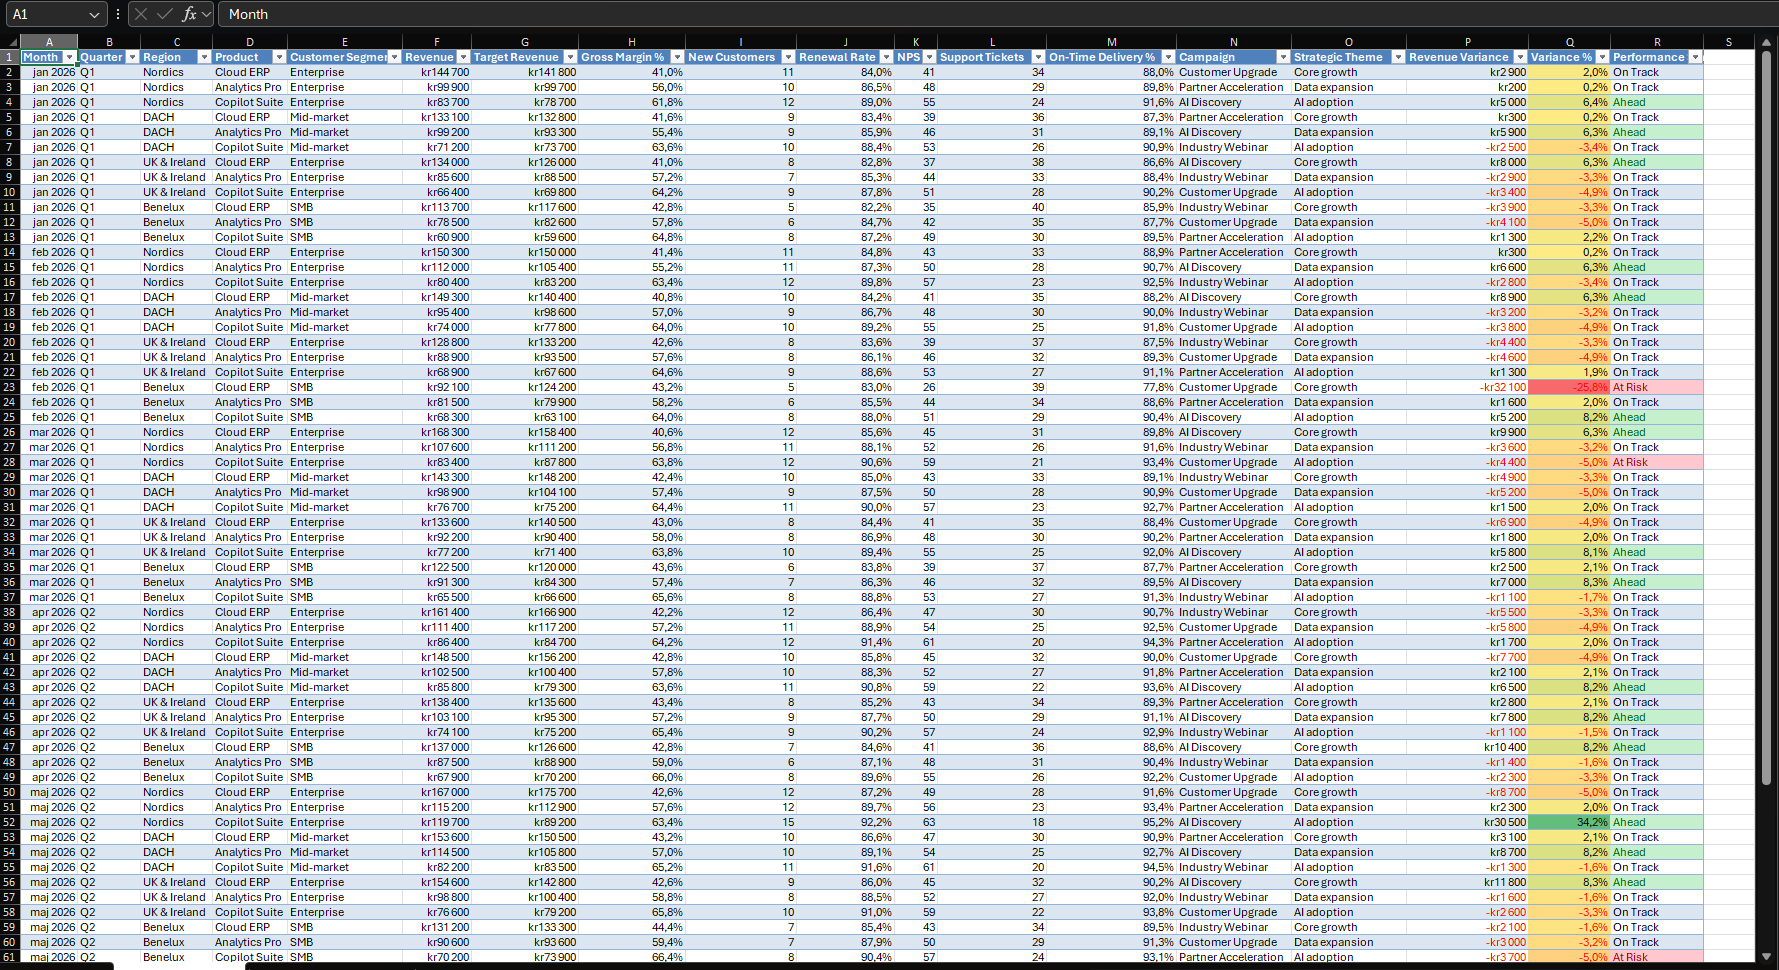
Scenario: a sales lead exports a BC list with Open in Excel. The sheet is a flat table with 72 rows of monthly performance data. It answers every question, but only after manual work with PivotTables, slicers, and charts.
The goal is a one-prompt dashboard that a manager can filter without help.
Why this matters
BC reports often end in Excel. The reader of that file rarely wants to build a PivotTable. A dashboard inside the same workbook removes one hand-off.
Microsoft documents the interactive-canvas skill as a way to create dashboards and reports from workbook data. It says the canvas stays connected to the workbook and updates automatically. The pane in my test does not name the skill, and I did not call it with @interactive-canvas. I assume it ran, because the result matches the description.
The cost is one prompt. The trade-off is control, because the prompt does not fix the layout. Think of a ready meal: it is on the table in minutes, but you still read the label.
Architecture
Pattern: read-only toward Business Central. Inside Excel, Copilot writes a new sheet.
| Layer | Runs where | Role in this demo |
|---|---|---|
| Business Central | Inside BC | Source of the data in a real case. Not used in the demo. |
| Excel workbook | Excel | Sheet Performance Data with 72 records. |
| Copilot in Excel | Microsoft 365 | Reads the workbook and builds the canvas. |
| Sales Performance sheet | Inside the workbook | Filters, KPI cards, insights, charts, and tables. |
Assumption: the workbook has synthetic data and stands in for a BC export.
Two boundaries matter in a real case. First, data leaves BC when the user exports it. The user needs the D365 Excel Export Action permission set or system permission 6110. Second, Open in Excel does not publish changes back to BC, but Edit in Excel does. Use Open in Excel for dashboards, so that a Copilot workbook stays away from the publish path.
The design differs from the previous post. A PowerPoint interactive slide holds a copy of the data and does not follow the workbook, but the Excel canvas lives in the workbook.
Demo steps
- Format the data as a table with clear headers. Microsoft’s dashboard guidance asks for the same.
- Open Copilot with the icon in the lower-right corner. Microsoft says edit mode is the default.
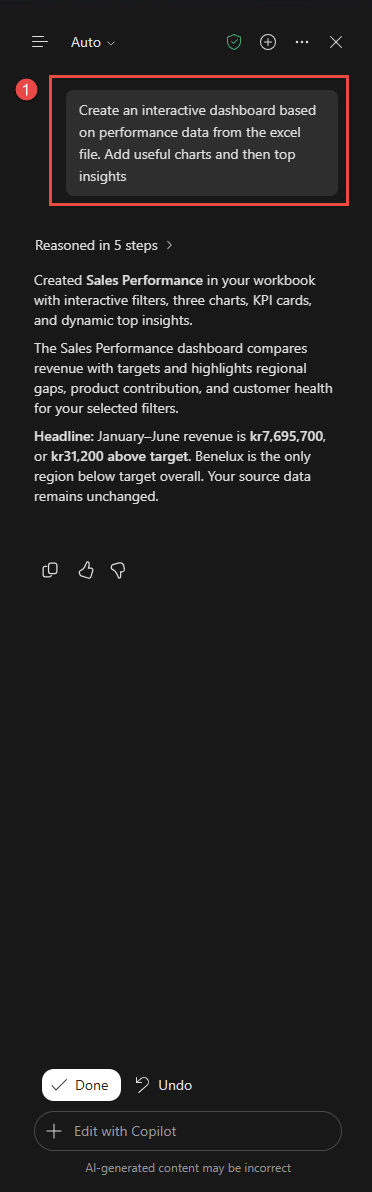
- Send this prompt:
Create an interactive dashboard based on performance data from the excel file. Add useful charts and then top insights. -
Read the response. Copilot reasoned in five steps and created a sheet named Sales Performance. The pane shows Done and Undo.
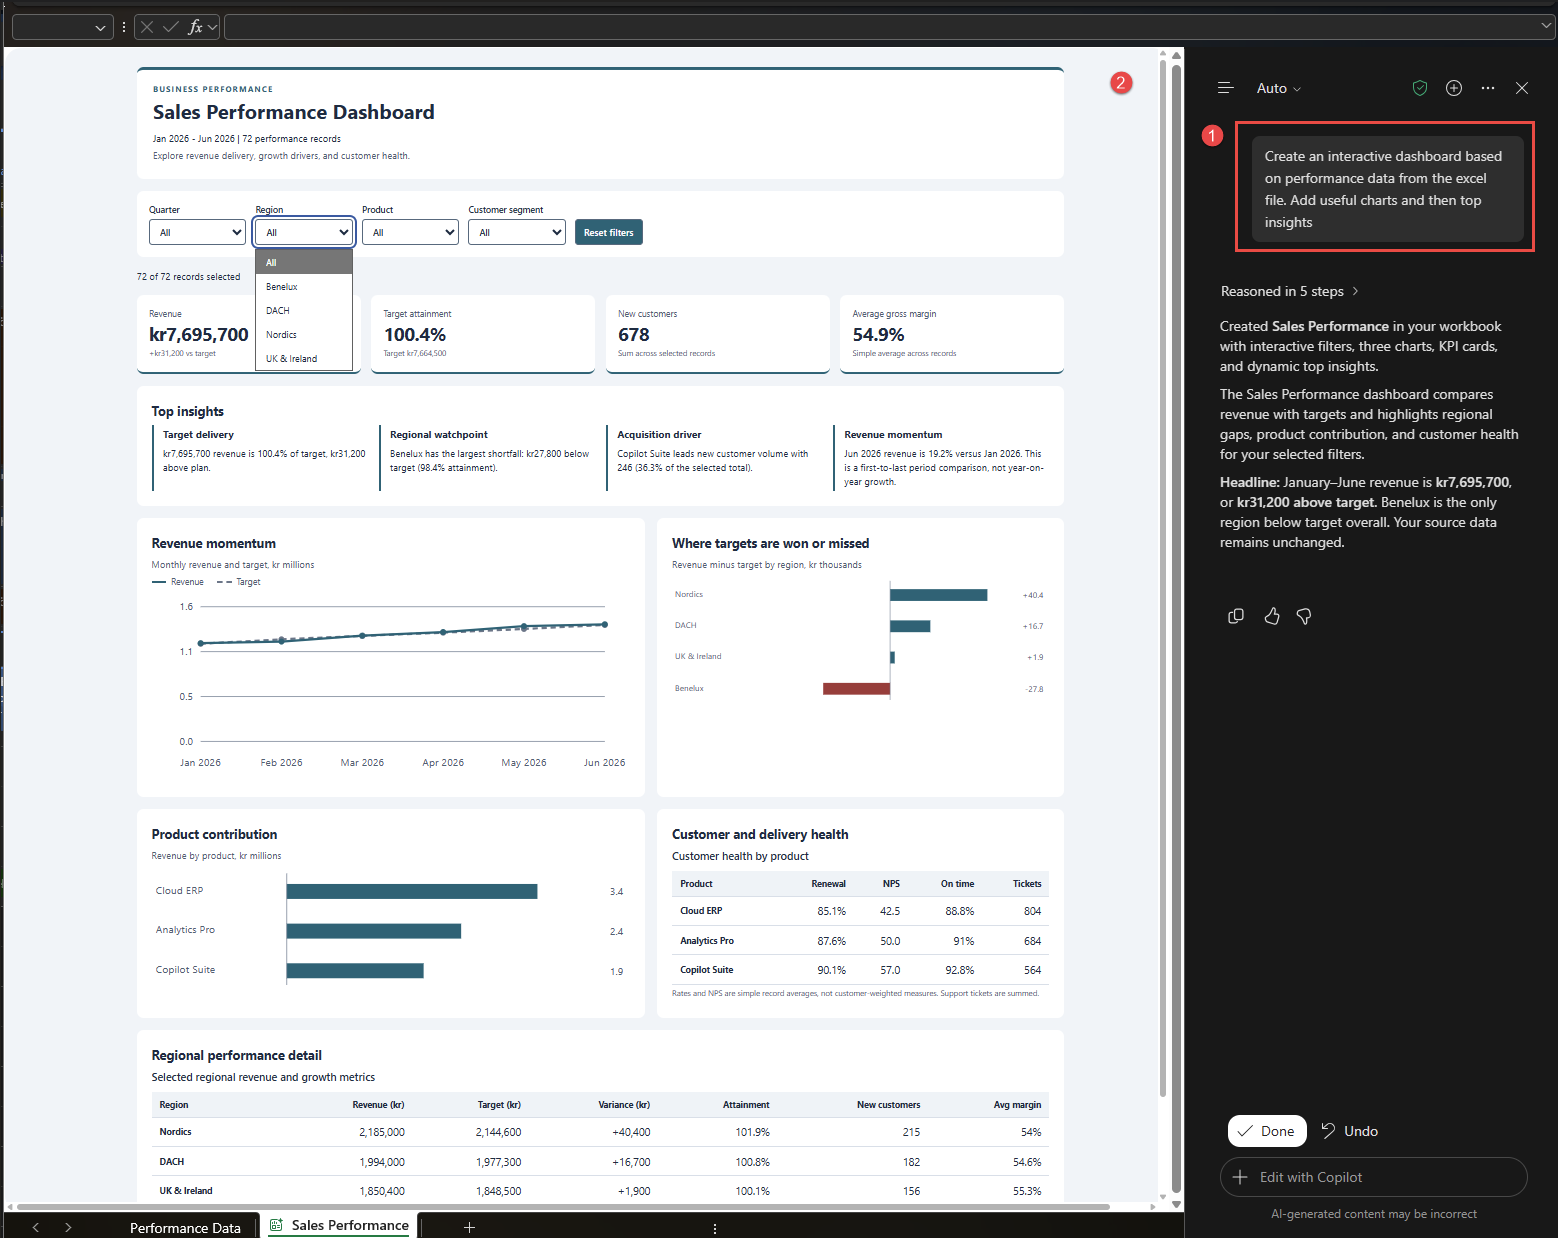
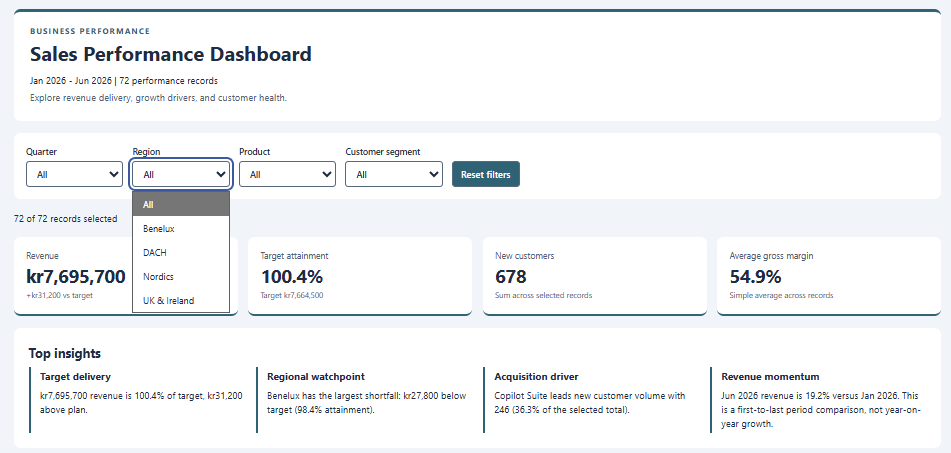
- Open the filters. The dashboard has Quarter, Region, Product, and Customer segment. A Reset filters button clears them. The counter reads 72 of 72 records selected. Choose a region and check that the cards, insights, and charts change.
-
Read the top insights. The canvas shows four: target delivery, a Benelux watchpoint, Copilot Suite as the acquisition driver, and revenue momentum.
-
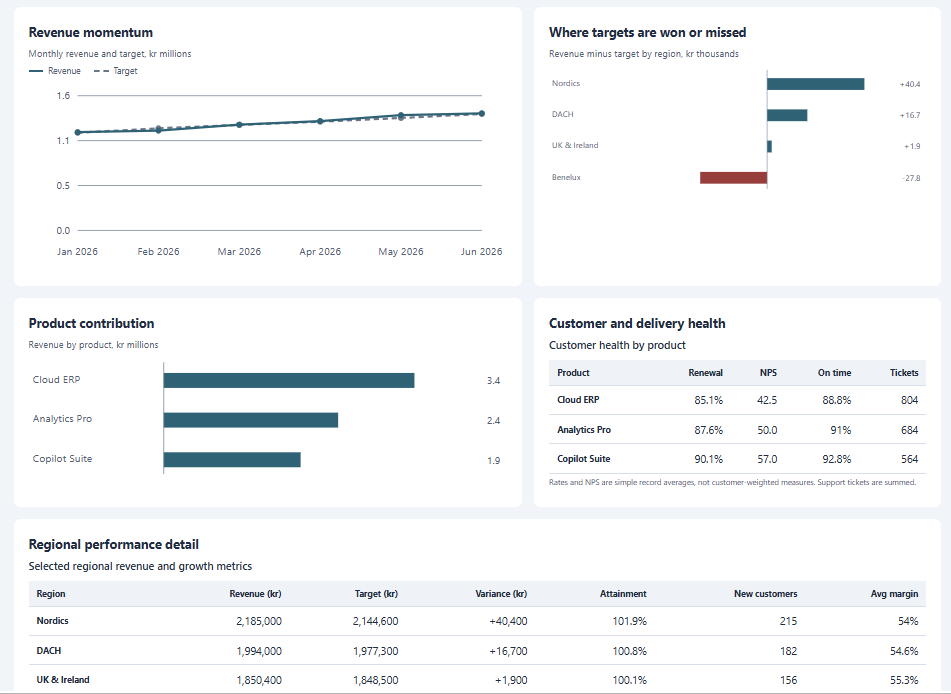
Scroll to the charts. There are three: revenue against target by month, revenue minus target by region, and revenue by product. Two tables follow: customer and delivery health, and regional detail.
- Change one revenue value in Performance Data and watch the canvas. Microsoft says it updates as data changes. I did not run this test for this post.
What is intentionally simple
- One prompt. No layout, color, or metric definition in it.
- One synthetic workbook. No live BC connection, no refresh, no Edit in Excel.
- No named skill, no custom rules, no brand kit.
- No check of the dashboard on Excel for the web or on Mac.
Risks and limits
- Verify the numbers. I checked the headline values against the source rows. Revenue is kr7,695,700, target is kr7,664,500, and new customers are 678. The 19.2% change from January to June also matches. Copilot labels it a first-to-last period comparison, which is not year-on-year growth.
- Metric definitions differ. The margin card shows 54.9% and says “simple average across selected records”. Weighted by revenue, the same data gives 52.6%. The previous post used the weighted figure. The customer health table also uses simple record averages. Copilot states this under the table, so a customer-weighted view needs a new prompt.
- Output varies. The prompt is open, so another run can give another layout or other insights.
- Copilot changes the workbook. It added a sheet, and it says the source data is unchanged. Use Undo if you do not want the sheet.
- Availability differs by source. The Excel blog says Insiders first. The Message Center post planned worldwide rollout from mid-October to the end of October. The October Copilot update says Insiders in October and worldwide in November. Check your own tenant.
- Licensing. Copilot in Excel needs an eligible license, as the Microsoft Support page explains.
- Not a governed report. BC permissions do not follow the exported data, so anyone with the file sees all rows in it.
Next iteration
- Test the refresh path: Edit in Excel, refresh in the add-in, and check if the canvas follows. Microsoft does not document this combination, so I treat it as untested.
- Name the metrics in the prompt, for example margin weighted by revenue.
- Compare the result with a Power BI report on the same BC data.
Closing note
One prompt gave a useful first dashboard. The margin card is the label that a person must still read. Treat the canvas as a fast draft for a known data set, not as a source of truth.