
Naming the Skill: Calling interactive-canvas in Copilot for Excel
Note: This blog is a personal notebook. I write it to record what I work on, for my own reference, not to publish it on social media or to promote myself. If a post is still useful to you, I am glad, but that is not why it exists.
This post was published on November 01, 2026. Software versions, product features, links, and tool availability may have changed since then. Always check official documentation for the latest information. Some screenshots show small details. Zoom in on the page to see them clearly.
My last Excel post used a generic prompt: “create an interactive dashboard”. This post names the skill in the prompt. Microsoft lists interactive-canvas as a built-in Copilot in Excel skill. The test uses the same synthetic sales data, framed as a Business Central (BC) export.
Problem
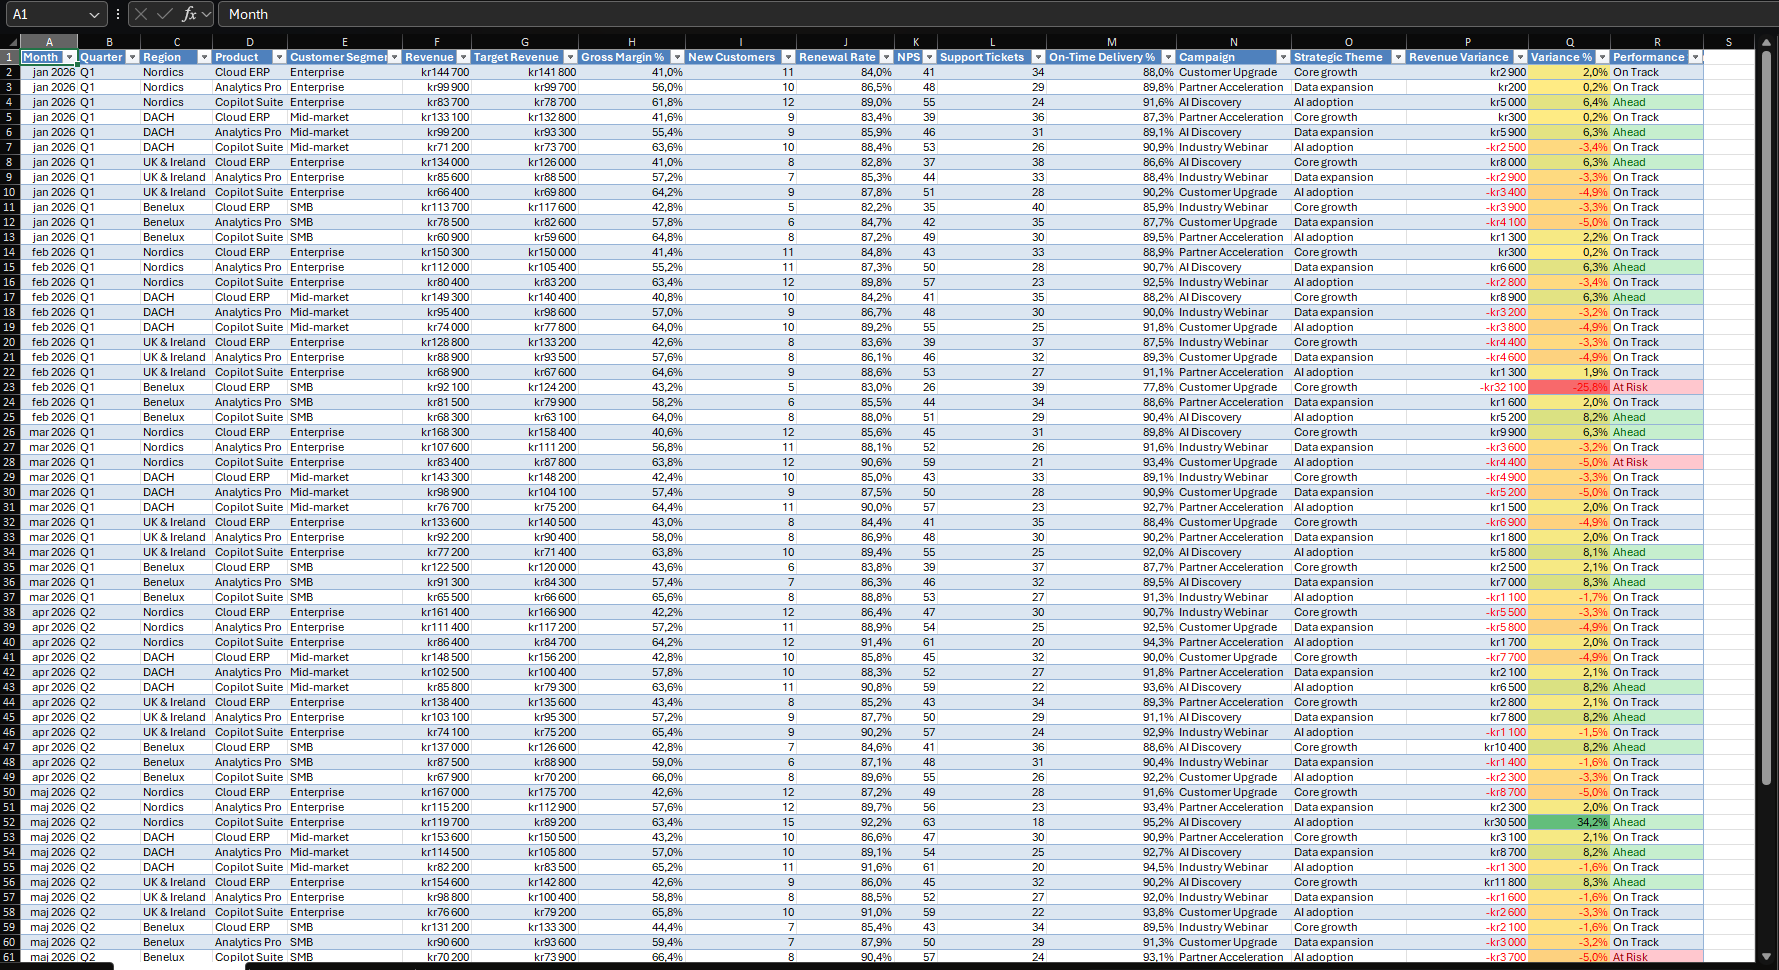
Scenario: a sales lead uses Open in Excel on a BC list and gets 72 rows of monthly performance data: revenue, target, margin, new customers, and delivery. The lead needs a view that a manager can filter without help.
A generic prompt gives a dashboard, but the user does not control how Copilot builds it. Naming the skill is like asking for a hairdresser by name: you know who does the work. The question is whether the result is also more predictable.
Why this matters
Microsoft describes the skill as a way to build dashboards and reports from workbook data. It says the canvas stays connected to the workbook and updates as the data changes, and that the skill is enabled by default.
Skills have a control surface. You can pick a skill from the Choose plugins and skills menu or type it with an @mention. You can switch skills on or off in Manage plugins & skills. A skill that is off can still run with a direct @mention.
Architecture
Pattern: read-only toward Business Central. Inside Excel, Copilot writes a new sheet.
| Layer | Runs where | Role in this demo |
|---|---|---|
| Business Central | Inside BC | Source of the data in a real case. Not used in the demo. |
| Excel workbook | Excel | Sheet Performance Data with 72 records. |
| Copilot in Excel with the interactive-canvas skill | Microsoft 365 | Reads the sheet and builds the canvas. |
| Commercial Pulse sheet | Inside the workbook | Filters, KPI cards, and chart panels. |
Assumption: the workbook has synthetic data and stands in for a BC export.
Skills do not move the trust boundary. Microsoft says skills do not add a new code-execution mechanism to Excel. The data boundary is the export, and the user needs the D365 Excel Export Action permission set or system permission 6110 for it. Use Open in Excel, not Edit in Excel. Open in Excel does not publish changes back to BC.
Demo steps
- Keep the data in a table with clear headers. Microsoft’s dashboard page gives the same advice.
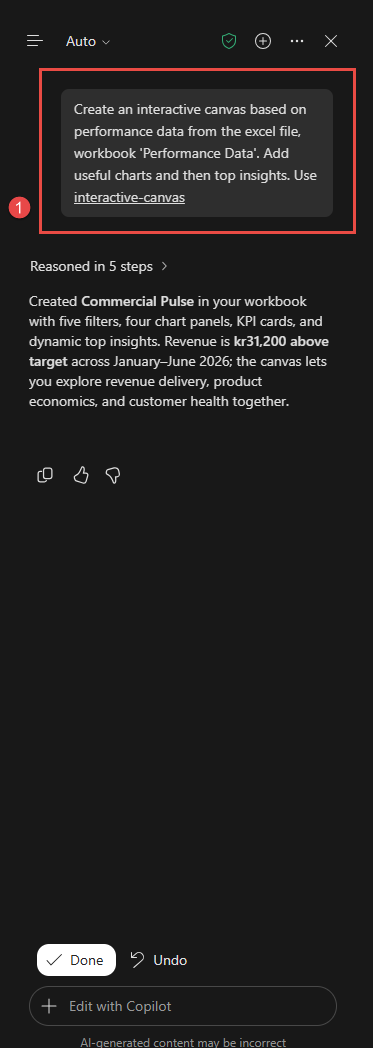
- Open the Copilot pane and send this prompt:
Create an interactive canvas based on performance data from the excel file, workbook 'Performance Data'. Add useful charts and then top insights. Use interactive-canvas. -
Read the response. Copilot reasoned in five steps and created a sheet named Commercial Pulse. It reports five filters, four chart panels, KPI cards, and top insights. The pane shows Done and Undo.
The prompt ends with the skill name. Microsoft documents
@interactive-canvasfor this call, and my prompt has no @ sign. The pane shows the name as a link, so I assume Copilot recognized it.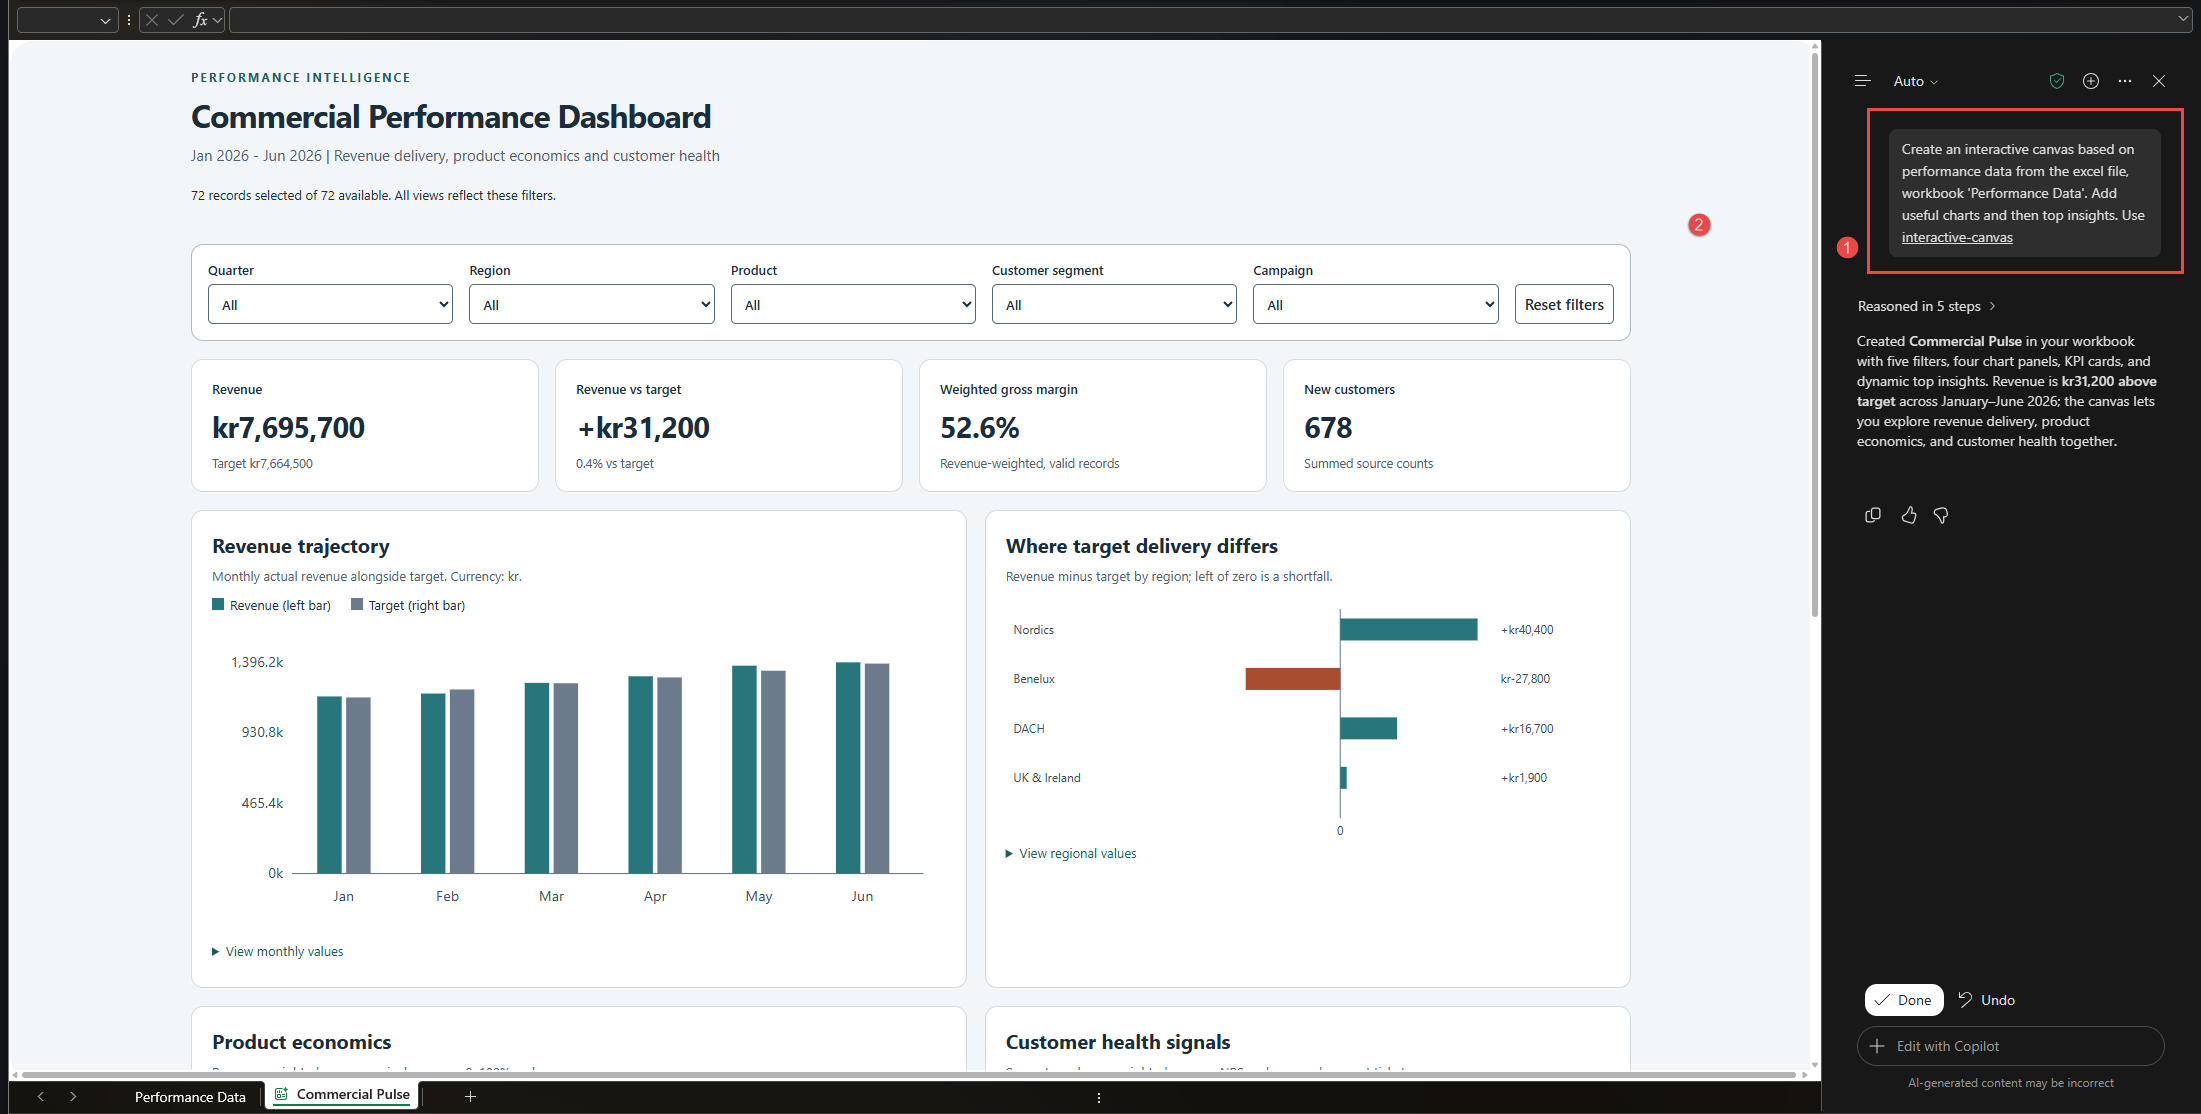
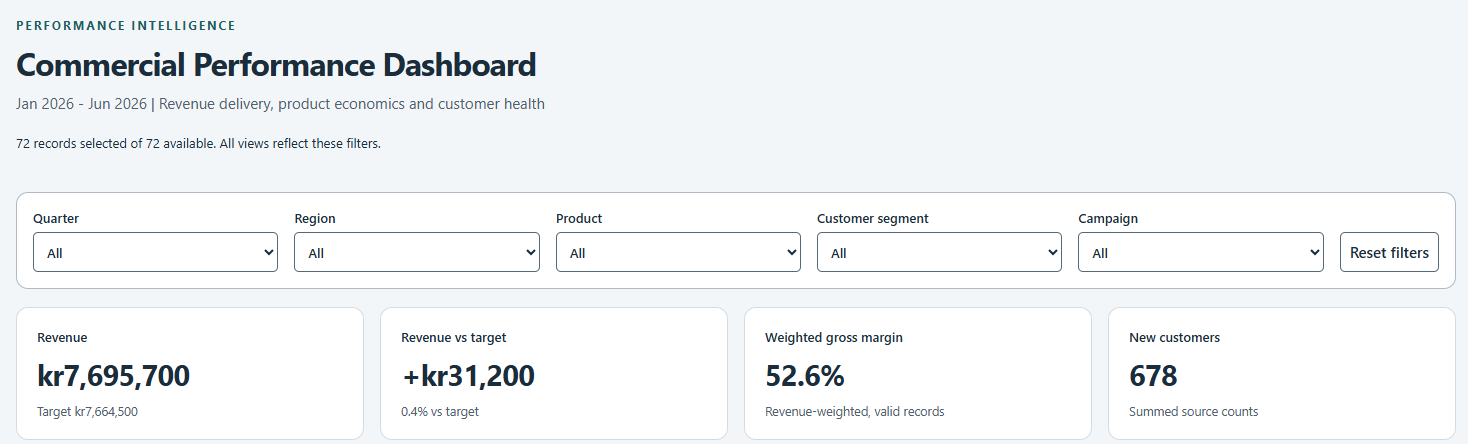
- Check the filters: Quarter, Region, Product, Customer segment, and Campaign. The header reads 72 records selected of 72 available. Choose a value and check that the views change.
-
Check the KPI cards. Revenue is kr7,695,700 against a target of kr7,664,500. Revenue vs target is +kr31,200. Weighted gross margin is 52.6%. New customers are 678.
-
Read the charts. Revenue trajectory shows revenue and target as paired monthly bars. Where target delivery differs shows revenue minus target by region. The two visible panels each have a collapsible list of values.
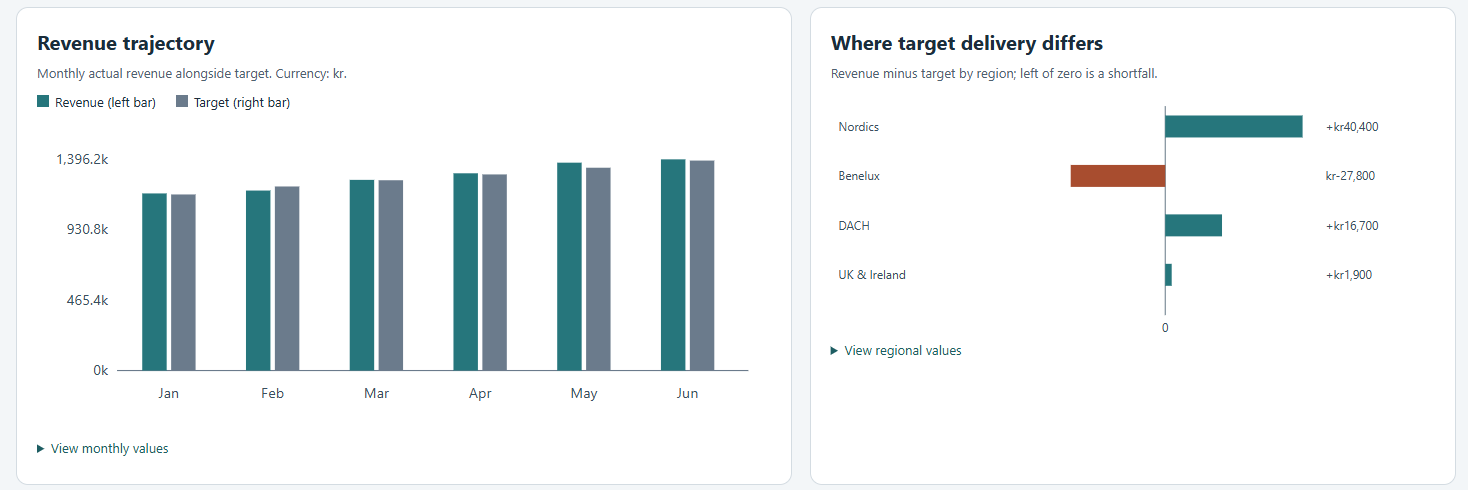
My screenshots stop above the Product economics and Customer health signals panels and the top insights, so this post makes no claim about them.
What is intentionally simple
- One prompt. One run. No layout or color instructions.
- One synthetic workbook. No live BC connection and no refresh.
- No custom skill, no workbook rules, and no brand kit.
- No test on Excel for the web or on Mac.
Risks and limits
- One run each. Copilot output varies, so I cannot say that naming the skill caused the differences.
- The runs differ. The unnamed run made a sheet named Sales Performance with four filters and three charts. It showed 54.9% as a simple average margin. This run made Commercial Pulse with five filters, including Campaign, and four chart panels. It shows 52.6% as a revenue-weighted margin.
- Verify the numbers. I checked revenue, target, new customers, the regional gaps, and the 52.6% margin against the source rows, and they match. A reader must still check the metric definition on each card.
- Metric choice is not stable. The same data gave two margin figures in two runs. If the definition matters, write it in the prompt.
- Language. Microsoft says Copilot was trained mostly on English sources and can perform less well with other languages. My Copilot pane is in English and my workbook uses Swedish number and date formats. The canvas shows the amounts in English format.
- Availability. The built-in skills page says the skill is rolling out and may not be available for all customers. The October Copilot update says Insiders in October and worldwide in November. Check your own tenant.
- Not a governed report. BC permissions do not follow the exported data, so anyone with the file sees all rows in it.
Next iteration
- Save the margin rule. Microsoft says a recorded task can be saved as workbook rules in a .Rules worksheet. Rules stay with the workbook. Test if a rule like “margin weighted by revenue” stabilizes the card.
- Test if the canvas updates when one source value changes. I did not run this.
- Test a refresh from Edit in Excel. Microsoft does not document this combination.
Closing note
Naming the skill is cheap and gives you a documented control point. It did not give a fixed layout in my test. Treat the canvas as a fast draft and fix the metric definitions in the prompt or in workbook rules.